Personal Project · B2B · Product Design · AI-Augmented Workflow
AI SEO Analytics Dashboard
Completed: March 2026 · Built with Next.js, Tailwind CSS, Vercel
Context
My professional experience is rooted in B2C mobile apps. While this has built a strong foundation in user-centered design, I recognized a clear gap: I had no hands-on experience designing B2B analytics products, tools that serve professional users who need fast, reliable access to structured data.
To address this directly, I initiated a self-directed project. I designed and built a functional SEO analytics dashboard from the ground up, using an AI-native workflow to compress a standard multi-week process into seven days. The goal was not speed for its own sake. It was to force real design decisions under real constraints.
Problem
SEO professionals and digital marketers spend a significant part of their day switching between tools: one platform for keyword rankings, another for backlink data, another for page performance. Each tool has its own logic, its own visual language, and its own export format. The result is that insight arrives late, and action arrives even later.
The core design challenge: how do you bring fragmented data into a single interface without creating new complexity?
Objective
Define an information architecture that supports quick insight retrieval, not just data display
Design a dashboard structure that scales from high-level overview to granular detail without losing context
Validate the design through a working prototype, not static mockups
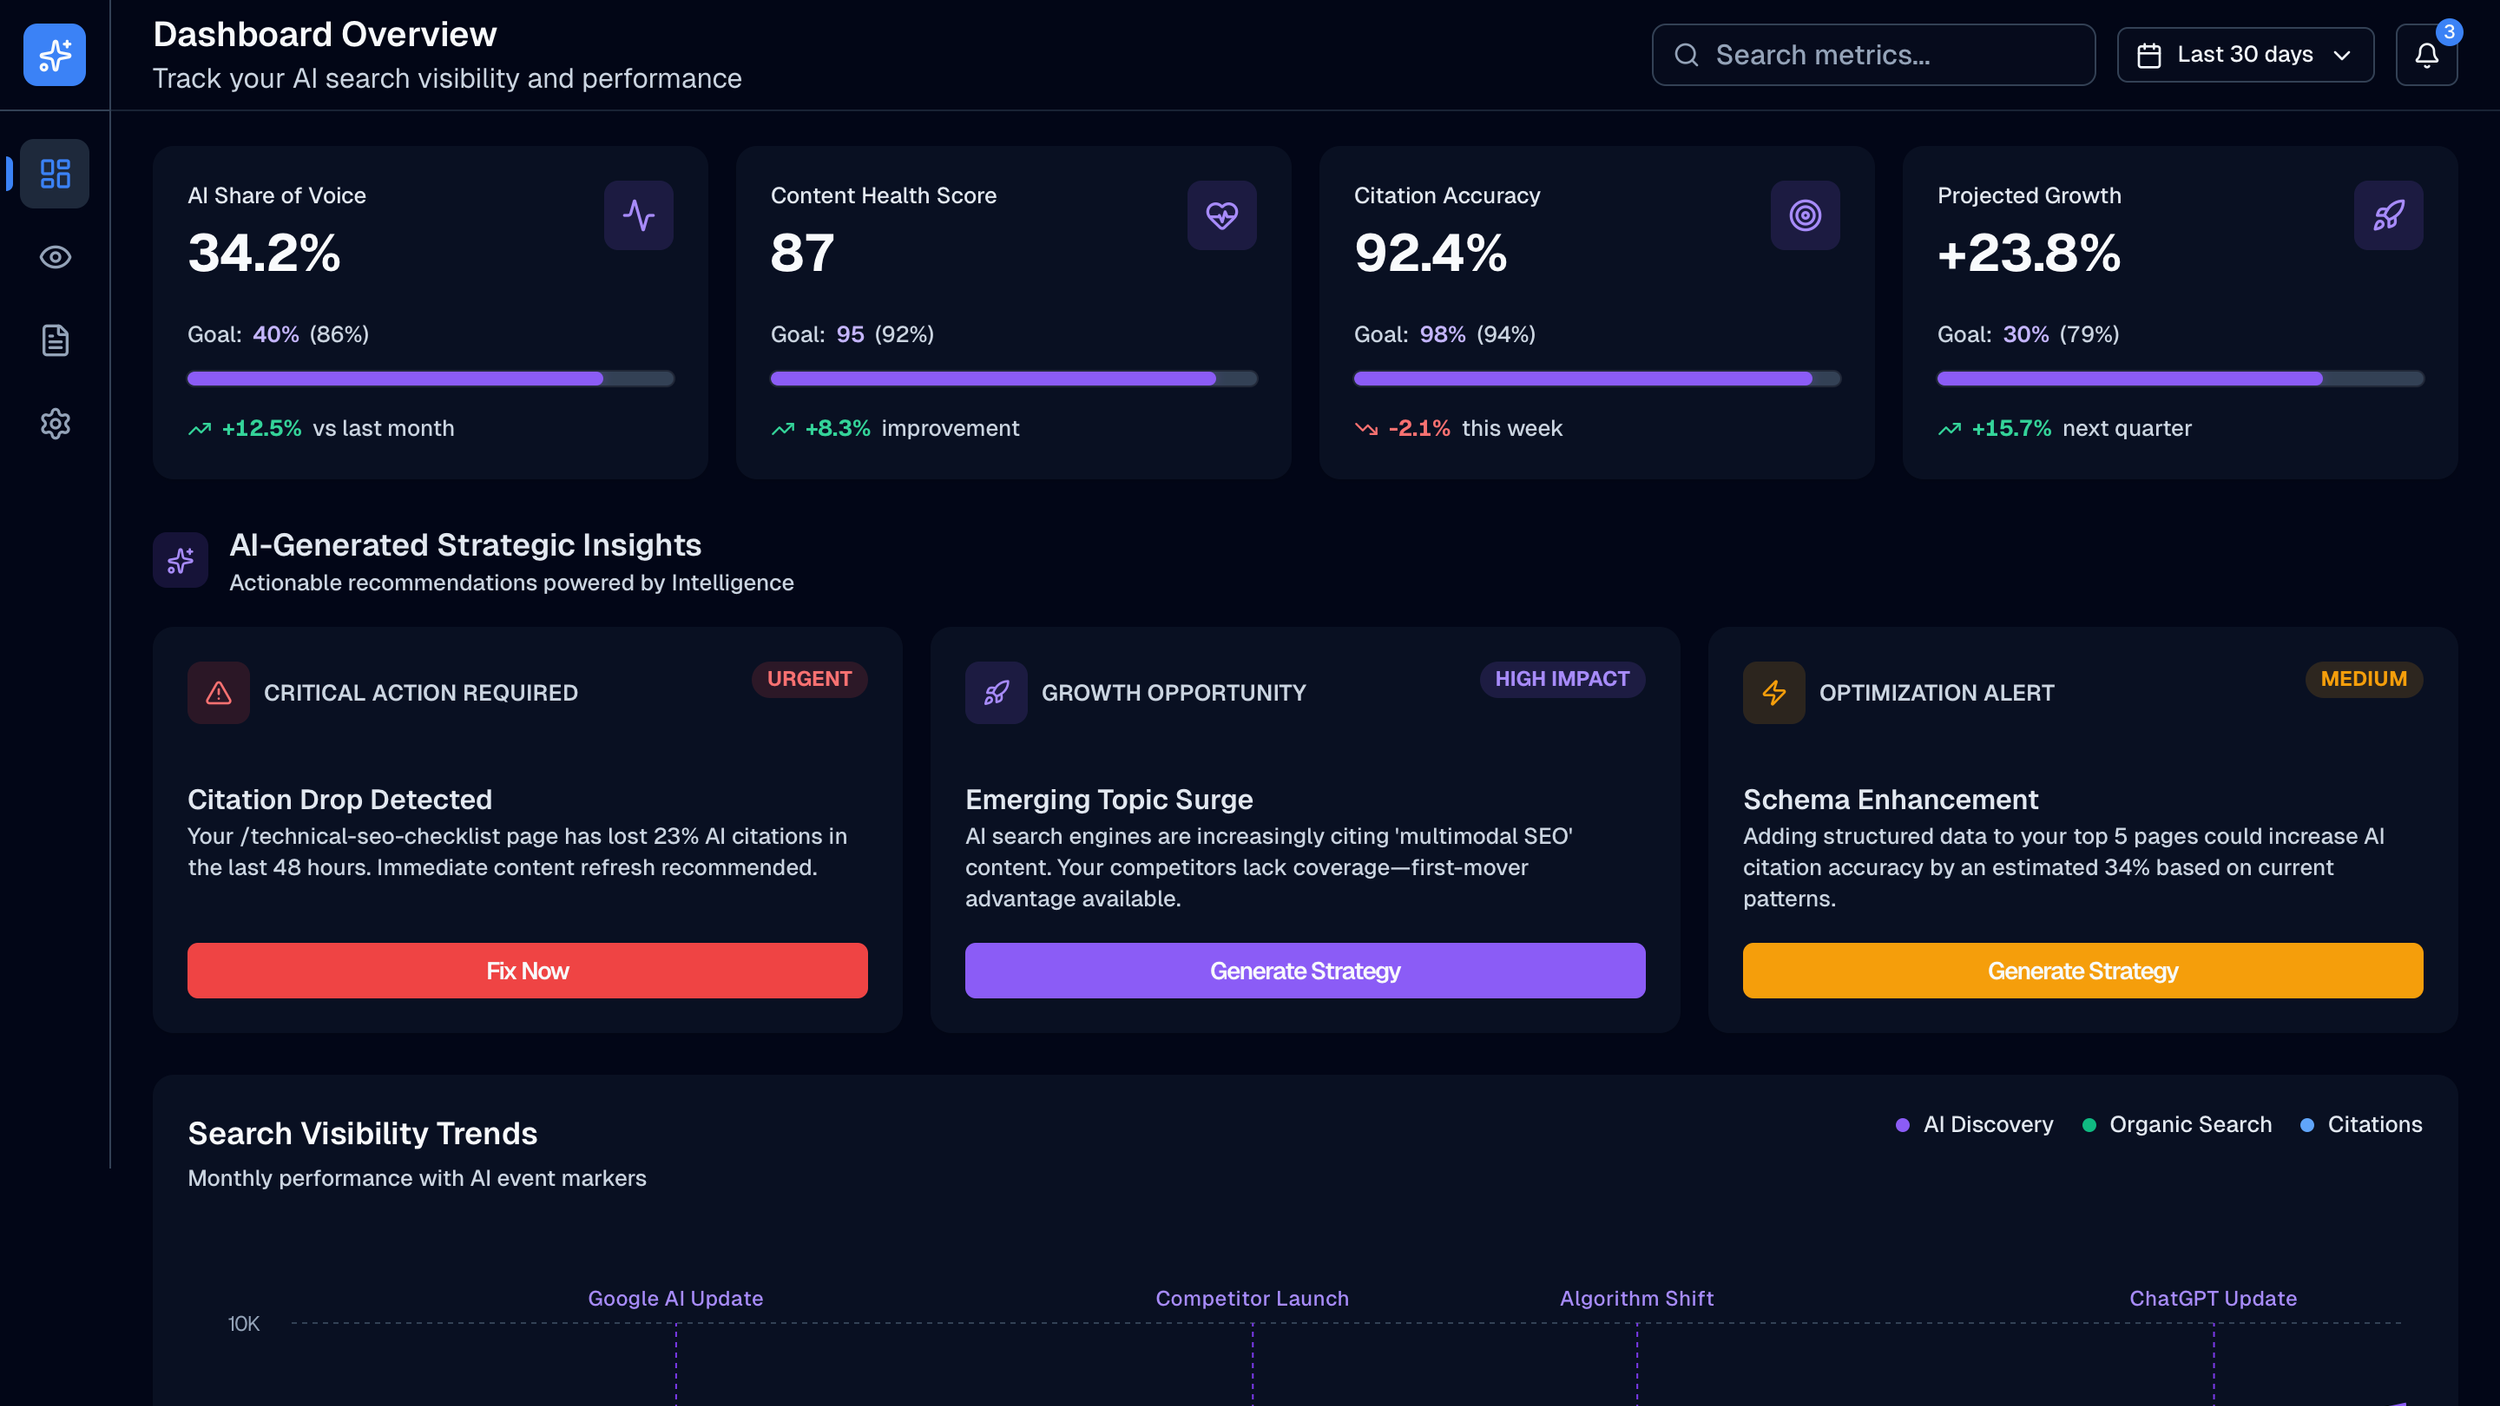
The main dashboard view : High-level status indicators sit at the top so the user can answer the first question ('what changed?') before scrolling
System Logic
Before opening Figma, I mapped the data entities and their relationships.
01 · Core Data Structure
Goal: Identify the three primary data types a user arrives with: Keywords, Pages, and Referencing Domains.
Logic: Each entity has its own table view, but they are connected. A keyword links to a page. A page links to domains that reference it. The dashboard must reflect this hierarchy without forcing the user to navigate three separate screens.
02 · Primary Action Path
Goal: Define the most common daily workflow.
Logic: The typical user arrives with one question: "What changed since yesterday?" The landing view must answer this before the user scrolls. Status indicators, delta values, and trend lines sit at the top. Detailed tables sit below.
03 · Detail Layer
Goal: Allow the user to move from summary to detail without leaving the page.
Logic: Clicking any row opens a contextual sidebar, not a new page. This keeps the user anchored in their current view while accessing deeper data. The sidebar closes without disrupting the table state.
04 · Filtering & Sorting
Goal: Designed at the architecture level, not added as a UI feature later.
Logic: Every table column is sortable. Filters apply across all three entity types simultaneously. A persistent filter bar at the top of the interface shows active filters so the user always knows what they are looking at.
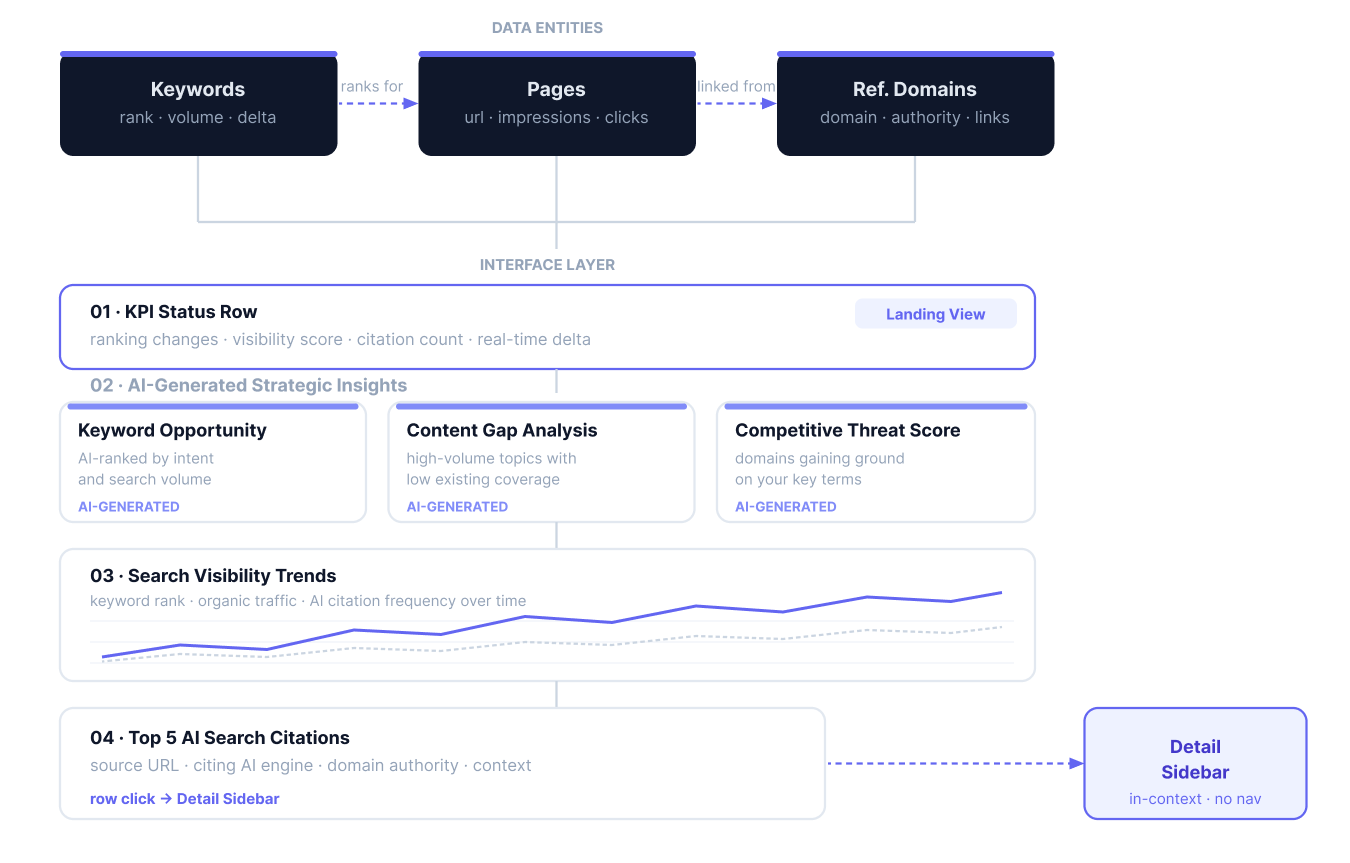
Data architecture before interface design. Mapping entity relationships first prevented structural problems later in the process
Approach
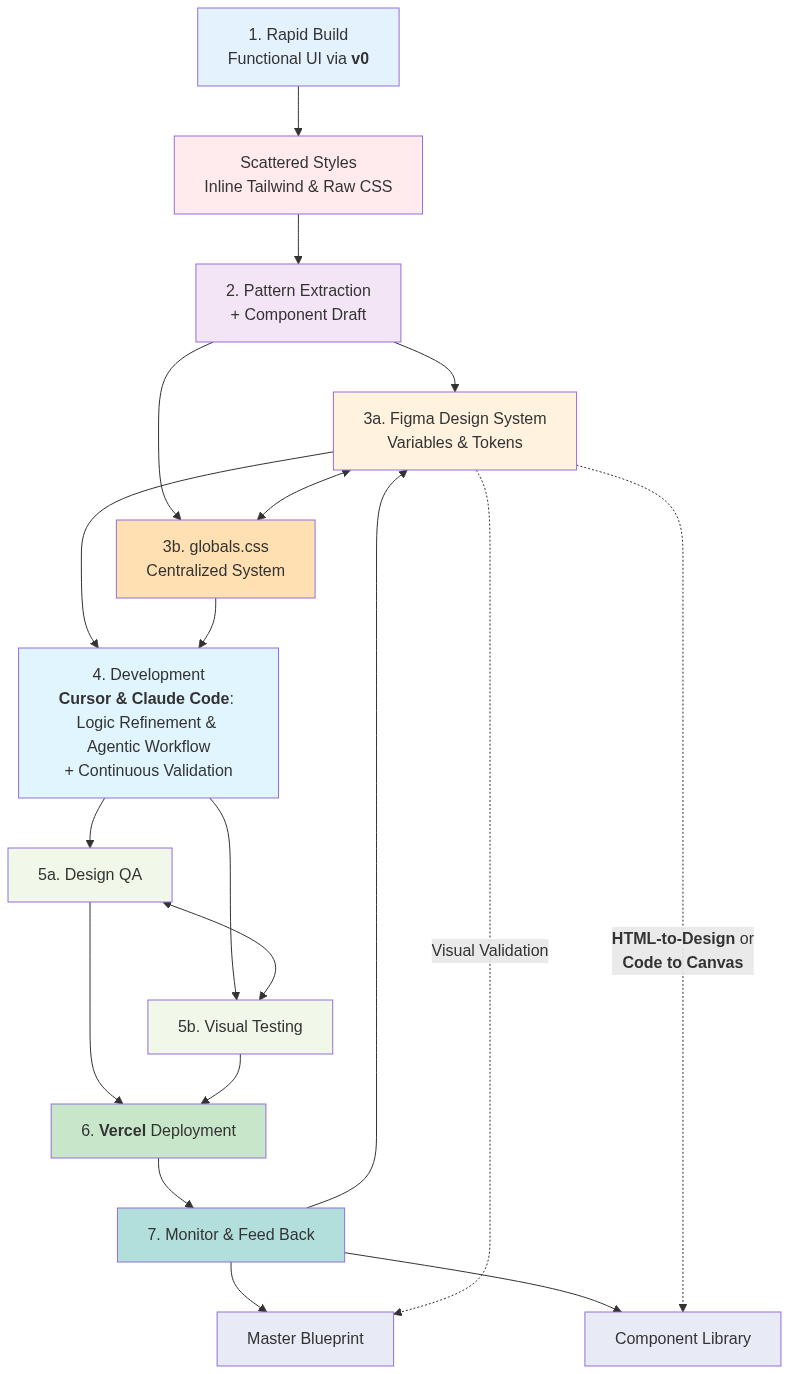
Starting with working code, not wireframes
I used v0 to generate the first functional draft based on a written brief. This gave me a real interface to react to immediately, with actual data behavior, scrolling, and state, rather than a static layout. Design decisions became faster because the consequences were visible.
AI-assisted component logic
I used Cursor and Claude Code to build and iterate component variants. When a table needed to handle empty states, overflow, and loading states, I could test all three at once in a live environment. This is not possible in Figma alone.
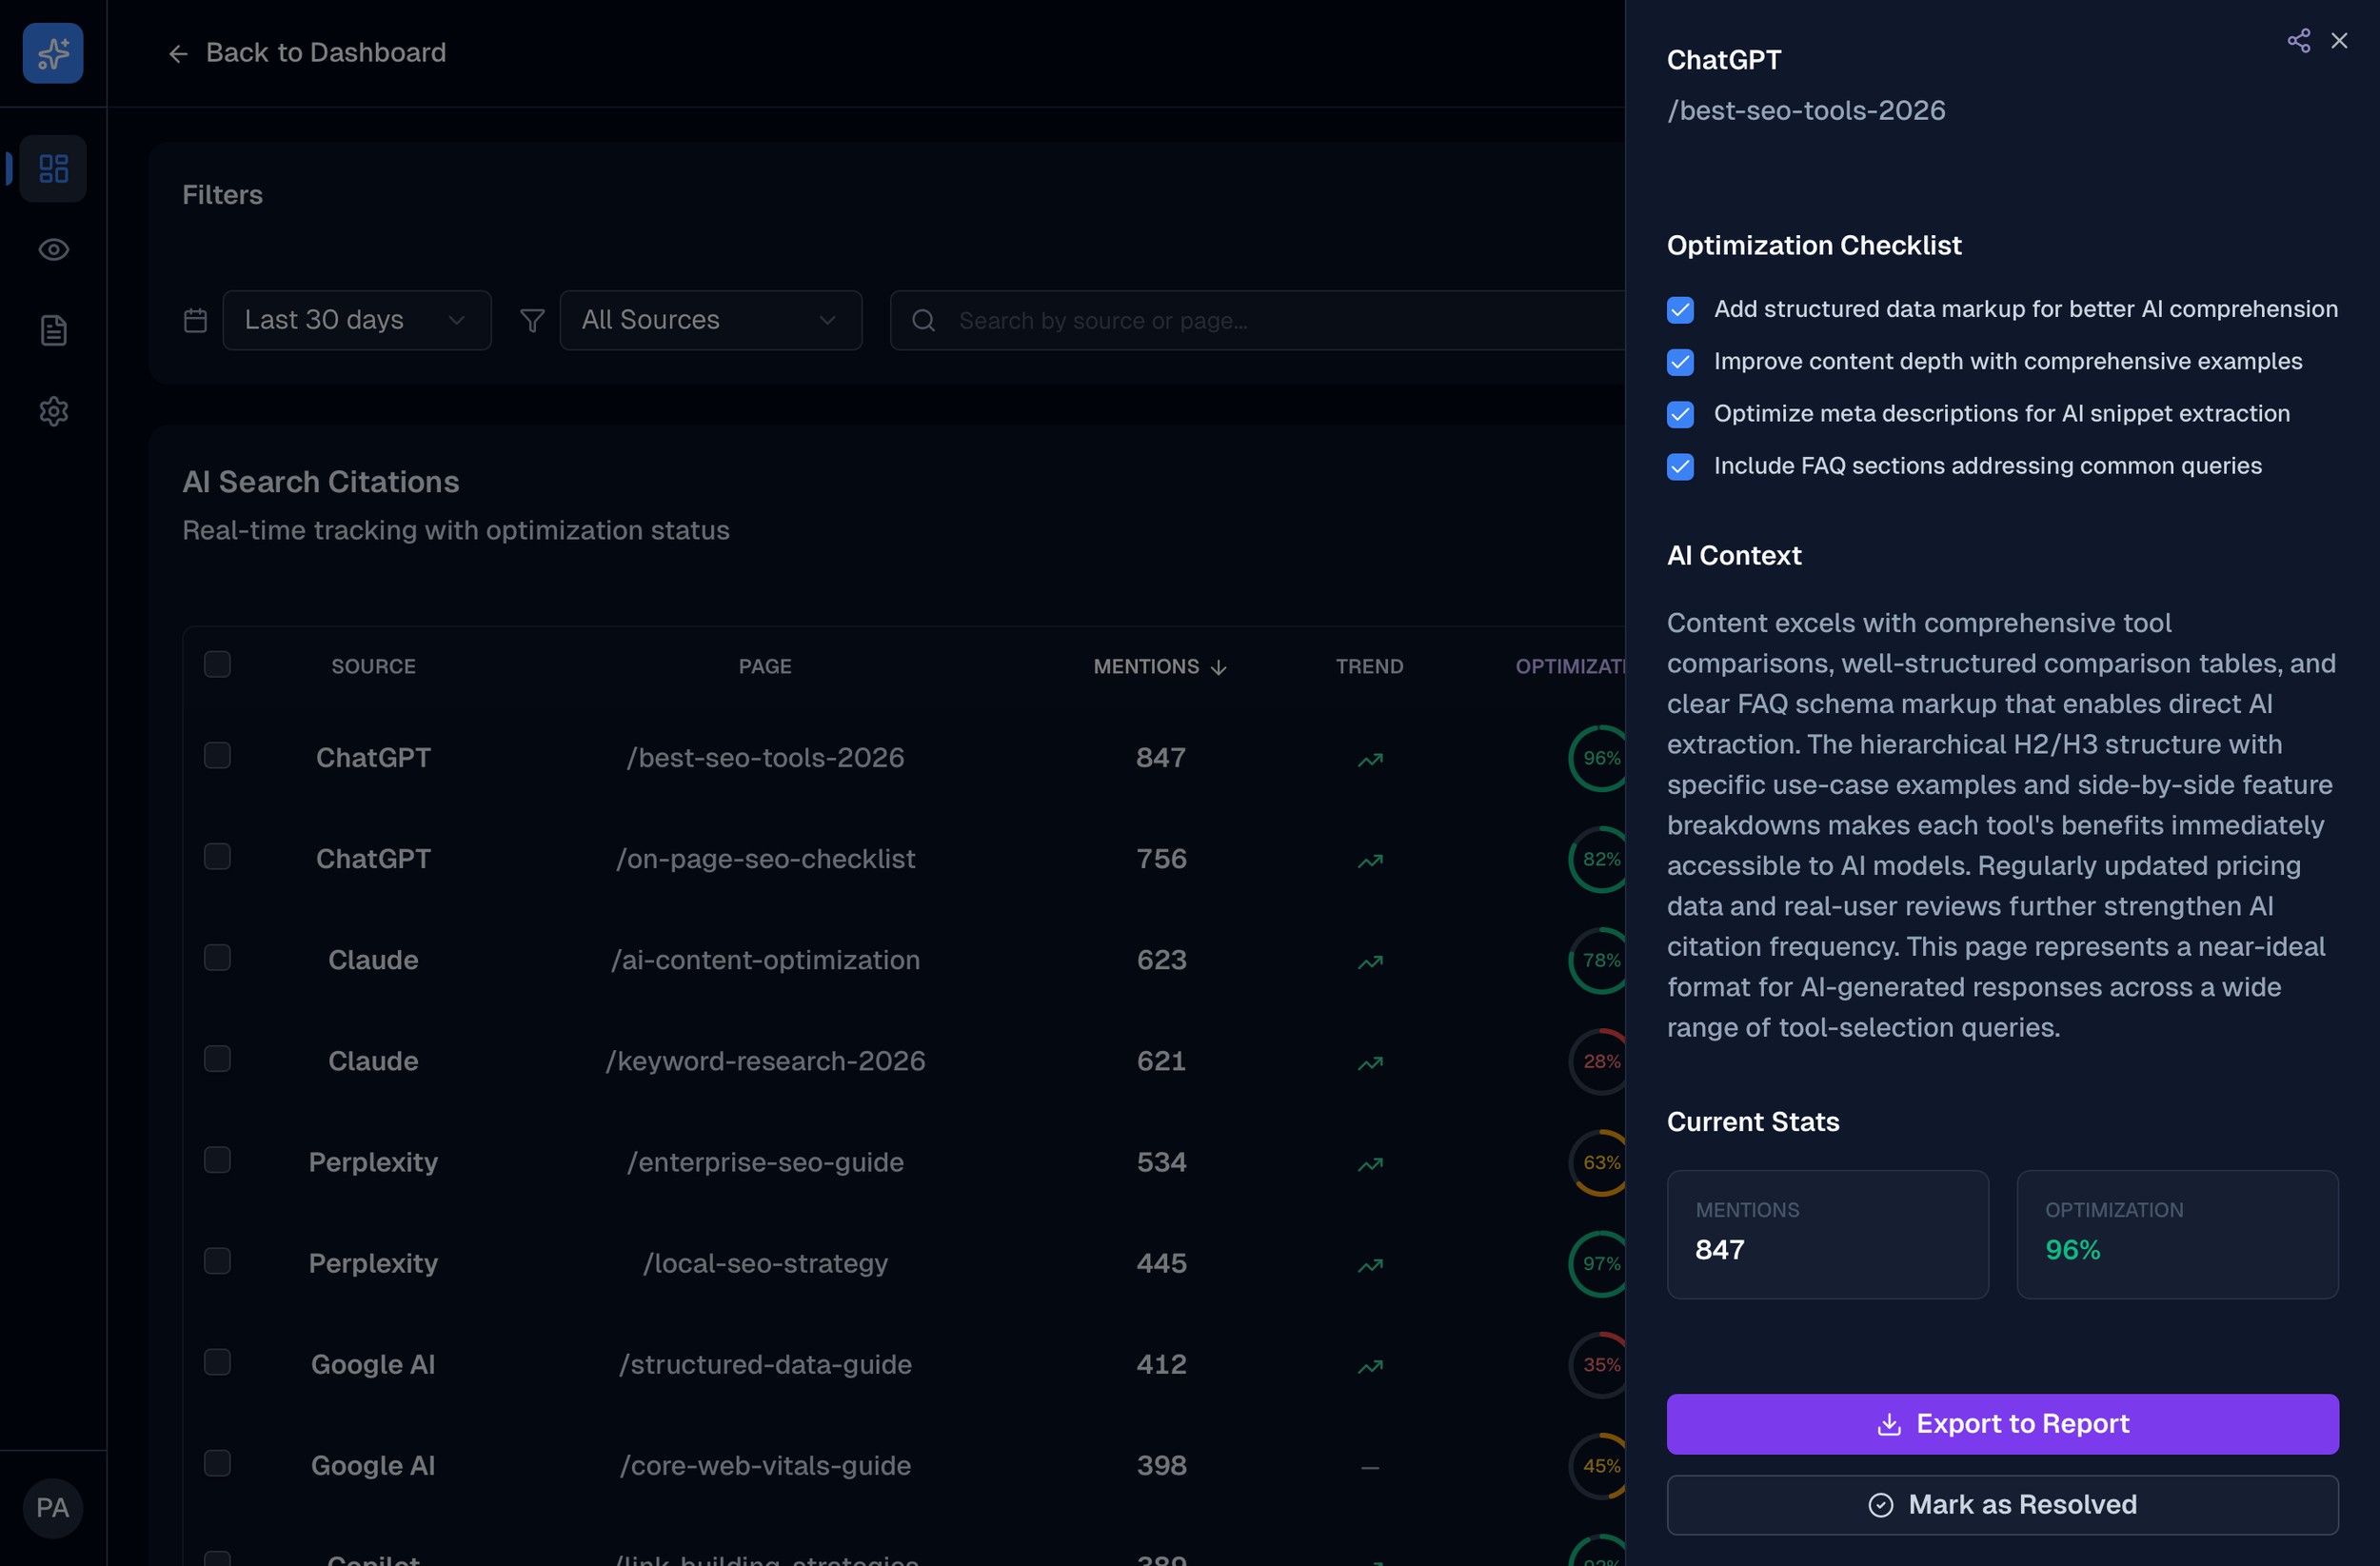
The detail sidebar opens in context, without navigating away from the current table view. The user stays oriented.
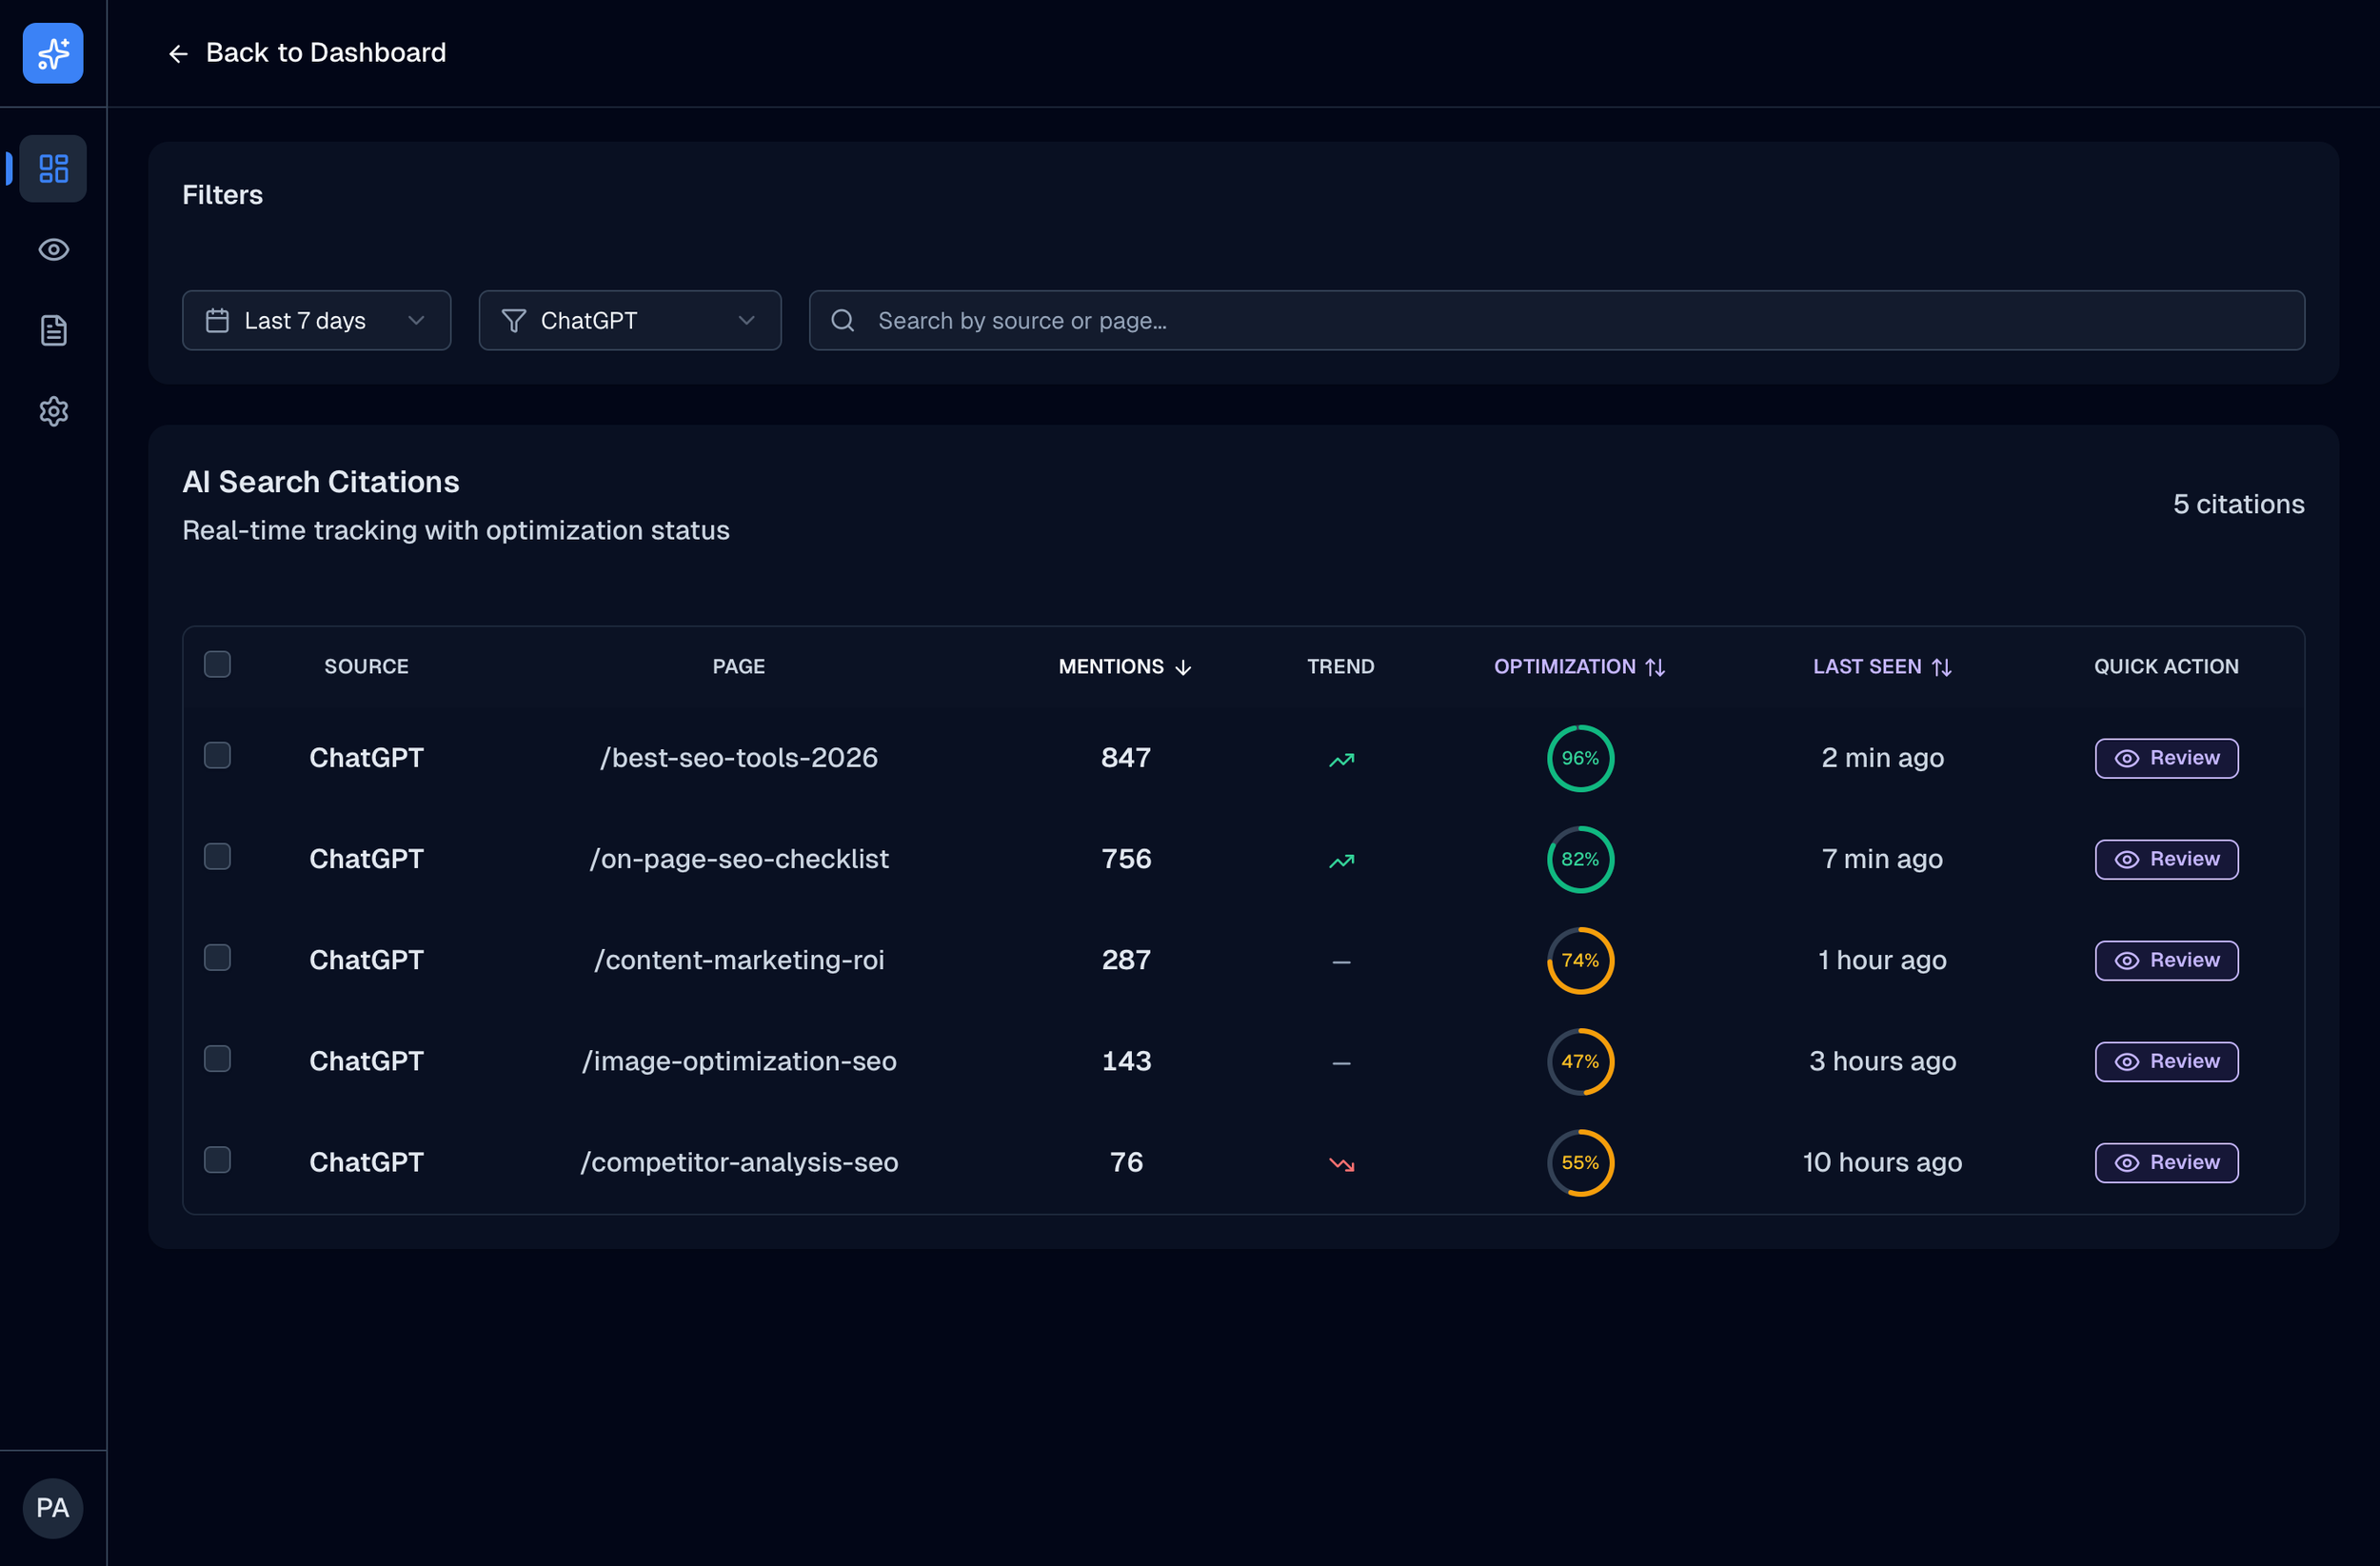
Active filters are always visible. The user knows exactly what they are looking at, without having to remember what they clicked.
Prototype over presentation
The final deliverable was a deployed Vercel application, not a slide deck. This meant every interaction (hover states, filter behavior, sidebar open/close) was testable in a real browser.
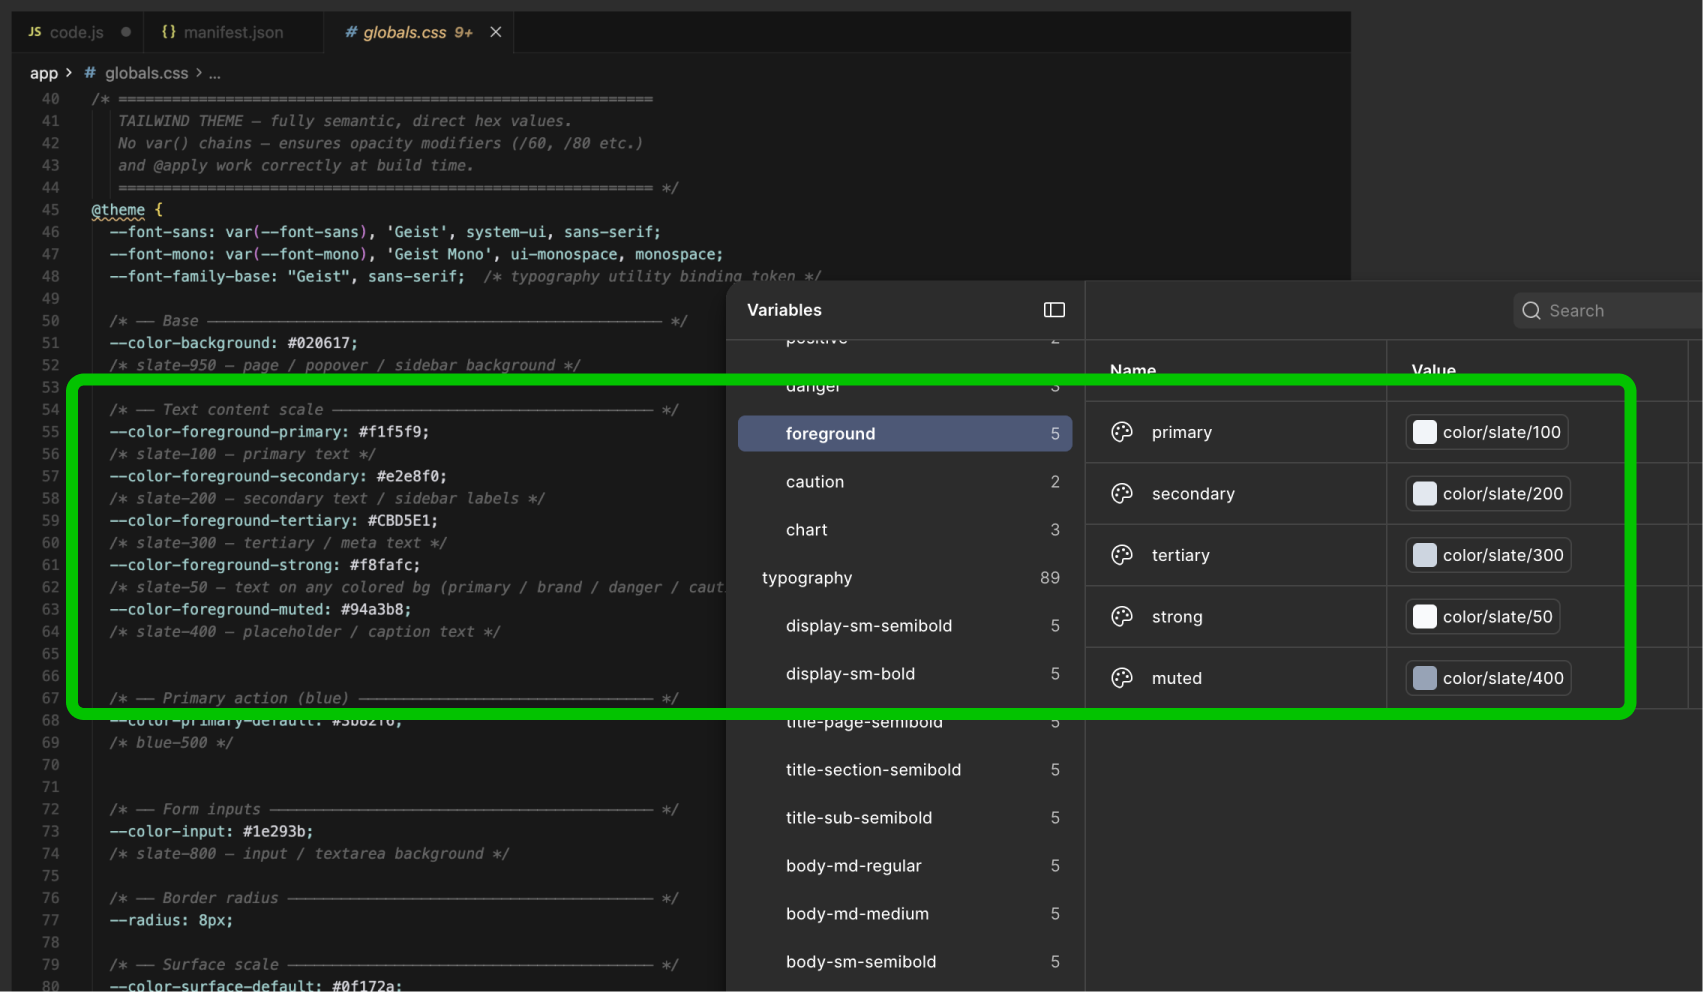
Design tokens aligned directly with the codebase. A change in one environment updates the other, with no manual translation required.
Figma as a governance layer, not a starting point
After the working prototype was stable, I built the design system in Figma, aligning variables directly with Tailwind CSS tokens. This created a Single Source of Truth between the design file and the codebase. Any change to a token updated both environments.
Outcomes
Delivered a fully functional B2B analytics prototype in seven days
Established a Figma-to-code pipeline with 100% token synchronization, eliminating manual handoff steps
Validated two key UX patterns for data-heavy B2B tools: contextual sidebars over page navigation, and status-first layout hierarchy
Identified a recurring problem in B2B data design: filtering logic is almost always added too late in the design process, after the layout is already fixed
Design Learnings
B2B users arrive with a specific question. Unlike B2C users who explore, B2B professionals open a tool to find something specific. This changes the entire information hierarchy. The most important data must be visible without scrolling.
Filtering is architecture, not UI. In the first draft, I added filters as a UI component on top of an existing layout. This created conflicts immediately: column widths broke, table headers shifted. I had to rebuild the layout around the filter logic, not the other way around.
Working in code reveals what Figma cannot. Static mockups do not show what happens when a table has 200 rows, or when a filter returns zero results. Building in a live environment forced me to design these states before they became problems.
AI-native workflow shifts the designer's focus. When component generation is handled by AI agents, the designer's attention moves upstream, to the logic, the hierarchy, and the decision-making, rather than to the execution of repetitive UI tasks.